Indonesia’s Investment Surge: What the National Numbers Say About Lombok
Indonesia recorded Rp3,923.2 trillion in investment over two years, with more than half outside Java. The figure is a national signal, not proof of capital reaching Lombok.
Quick answer: Indonesia recorded Rp3,923.2 trillion in investment from October 2024 to September 2026, with 51.8% outside Java. For Lombok investors, that is evidence of a more geographically dispersed national investment picture, but not proof of investment in Lombok itself. Local projects still need their own evidence on demand, costs and legal structure.
The headline figure invites an easy story: capital is moving beyond Java, so Lombok must be among the beneficiaries. That may be a hypothesis worth investigating, but the national figures alone cannot establish it. For investors, the useful exercise is to separate the scale of Indonesia’s investment from what the reported breakdown actually says about location, ownership and outcomes.
The Context
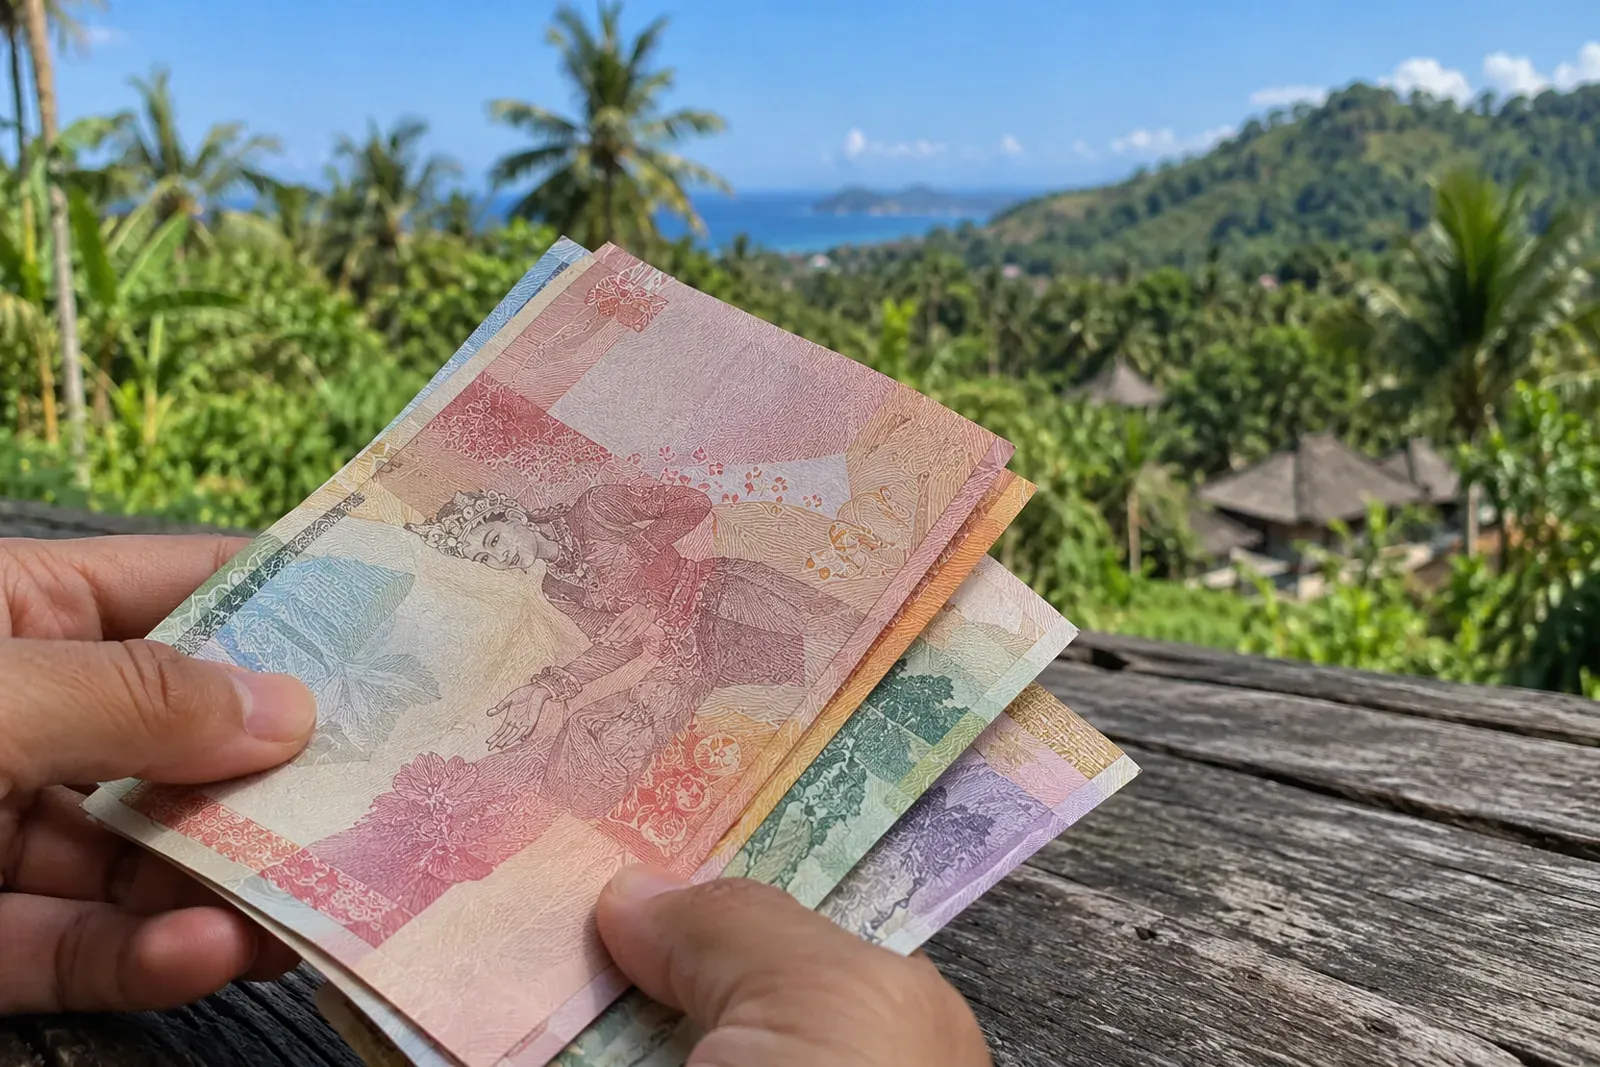
 Indonesia’s Investment Surge · Illustration: HubLombok (AI-generated)
Indonesia’s investment minister reported total inflows of Rp3,923.2 trillion (US$216.65 billion) across the first two years of President Prabowo’s administration, covering October 2024 to September 2026. The figures were reported by Antara Business from a statement released by the Presidential Secretariat. They describe a large national total over a defined period, rather than a forecast of future inflows or a measure of any single province’s performance.
The geographical split is notable. Investment outside Java accounted for 51.8%, or Rp2,031 trillion, while Java received 48.2%, or Rp1,892.2 trillion. This indicates that, in aggregate, investment recorded beyond the country’s most industrialised island slightly exceeded the Java total during the period. It does not show how that non-Java amount was distributed among Indonesia’s many provinces, or which projects received it.
51.8% of reported investment was outside Java. The figure signals geographic breadth, but the report does not allocate that share to Lombok or any other individual destination.
The same statement puts domestic investment at Rp1,998.7 trillion and foreign investment at Rp1,924.5 trillion. Both are substantial components of the overall figure. For an international reader, that mix is a reminder that Indonesia’s investment story is not solely a matter of overseas capital arriving. Domestic investors also account for a large share of the reported total.
The report also says investment during the period created jobs for 5.49 million people. That is a measure of employment associated with the reported investment, not a breakdown of job quality, permanence, pay or location. Those distinctions matter when assessing how much of a headline total translates into lasting economic capacity in a particular region.
Reading the investment mix
The outside-Java share is the most tempting point of comparison for a Lombok investor, but it needs a careful reading. “Outside Java” is a wide geographic category. It includes regions with different industries, infrastructure, labour markets and investment conditions. The reported share cannot tell an investor whether capital went to tourism, manufacturing, energy, transport or another sector, nor whether it was concentrated in a few large projects.
That limitation does not make the figure irrelevant. It does make it a context indicator rather than a local market metric. It suggests that investment recorded during the period was not confined to Java. Whether that broader distribution creates opportunities for a particular property, business or infrastructure-linked investment in Lombok is a separate question that requires location-specific evidence.
Ownership composition also deserves attention. The reported domestic and foreign totals are close in scale, with domestic investment slightly higher. But the report does not provide a sector-by-sector or province-by-province breakdown for either category. A foreign investor considering Indonesia should therefore avoid reading the national foreign-investment total as a proxy for overseas demand for Lombok property, or as evidence that a specific project has attracted foreign capital.
Investment totals can carry different meanings depending on how they are collected and presented. In this report, the minister describes investment inflows recorded over the period. The supplied figures do not provide project-level schedules, regional allocation tables or a comparison between announced commitments and completed projects. Without those details, the total is best treated as a broad measure of reported investment activity, not as a direct guide to the performance of an individual asset.
What the totals leave out
A national aggregate cannot answer the questions a buyer would ask before committing capital to a local project. It does not establish whether a site has secure title, whether a proposed use is permitted, whether access and services are adequate, or whether expected revenue can cover operating costs. Those questions call for due diligence and project-specific financial assumptions.
Nor does the jobs figure resolve the question of local economic benefit. The report provides one national employment total, but not the number of jobs in Lombok, the sectors in which they were created, or how long they lasted. It would be a stretch to infer a local employment effect from the national number alone.
There is a second set of figures in the report: restructuring under Danantara. The statement says 364 companies had undergone streamlining, with a target of 700 by the end of December 2026. It also reports that total corporate profitability is projected to reach Rp334 trillion by the end of 2026, based on current trends. These are corporate restructuring and profitability measures, not additional investment inflows.
That distinction is important for investors. A projection of corporate profitability is not a forecast of returns available from property or tourism assets. The figures may form part of the broader economic backdrop, but the report does not connect the projected profits to Lombok, to a particular industry or to investor distributions. Treating them as a local return signal would go beyond what the source supports.
What This Means for Investors
For investors considering Lombok, the report is most useful as a prompt for sharper questions. The national investment total and outside-Java share give scale and context; they do not make the investment case for a specific location. A disciplined reading keeps three layers separate: Indonesia’s aggregate investment, the distribution among regions and sectors, and the economics and legal position of the asset under consideration.
The next layer of evidence would need to be local and independently checkable. Investors can look for published regional investment data, project announcements with clear locations, planning and infrastructure information, and documentation that supports a project’s stated ownership and use. For a property investment, they should also assess acquisition costs, management arrangements, realistic occupancy assumptions and the distinction between gross income claims and net returns after costs.
The report provides a reason to keep watching how investment is distributed beyond Java. It does not show whether Lombok is gaining a particular share, whether tourism is driving the reported movement, or whether any local asset will benefit. Keeping that boundary clear is not excessive caution; it is the difference between using a macroeconomic signal as context and mistaking it for proof.
For a Lombok investor, the measured conclusion is therefore modest but useful: Indonesia reported a very large investment total over the period, and more than half was outside Java. That may support further investigation of regional opportunities. The investment decision itself still turns on verifiable local facts, sound project economics and legal due diligence.
Stay informed: subscribe to the free Lombok Briefing, published twice a month (the 1st and 15th), for market intelligence like this.
Does the investment outside Java figure show how much went to Lombok?
No. The report says investment outside Java accounted for 51.8%, or Rp2,031 trillion, but it does not break that amount down by province. The figure provides national context, not a Lombok-specific investment total.
How much of Indonesia’s reported investment was foreign?
The report gives foreign investment of Rp1,924.5 trillion and domestic investment of Rp1,998.7 trillion for October 2024 to September 2026. It does not provide a province-by-province or sector-by-sector split for those amounts.
Can investors use the corporate profitability projection to estimate Lombok returns?
No. The reported Rp334 trillion figure is a national corporate profitability projection for the end of 2026, based on current trends. The report does not connect it to Lombok, property income or returns from any specific investment.

The Lombok Buyer's Field Guide
Legal structures ranked by risk, the honest ROI math line by line, all six zones ranked, and the 24-point due-diligence checklist. The whole book, free in your inbox.
See what's inside