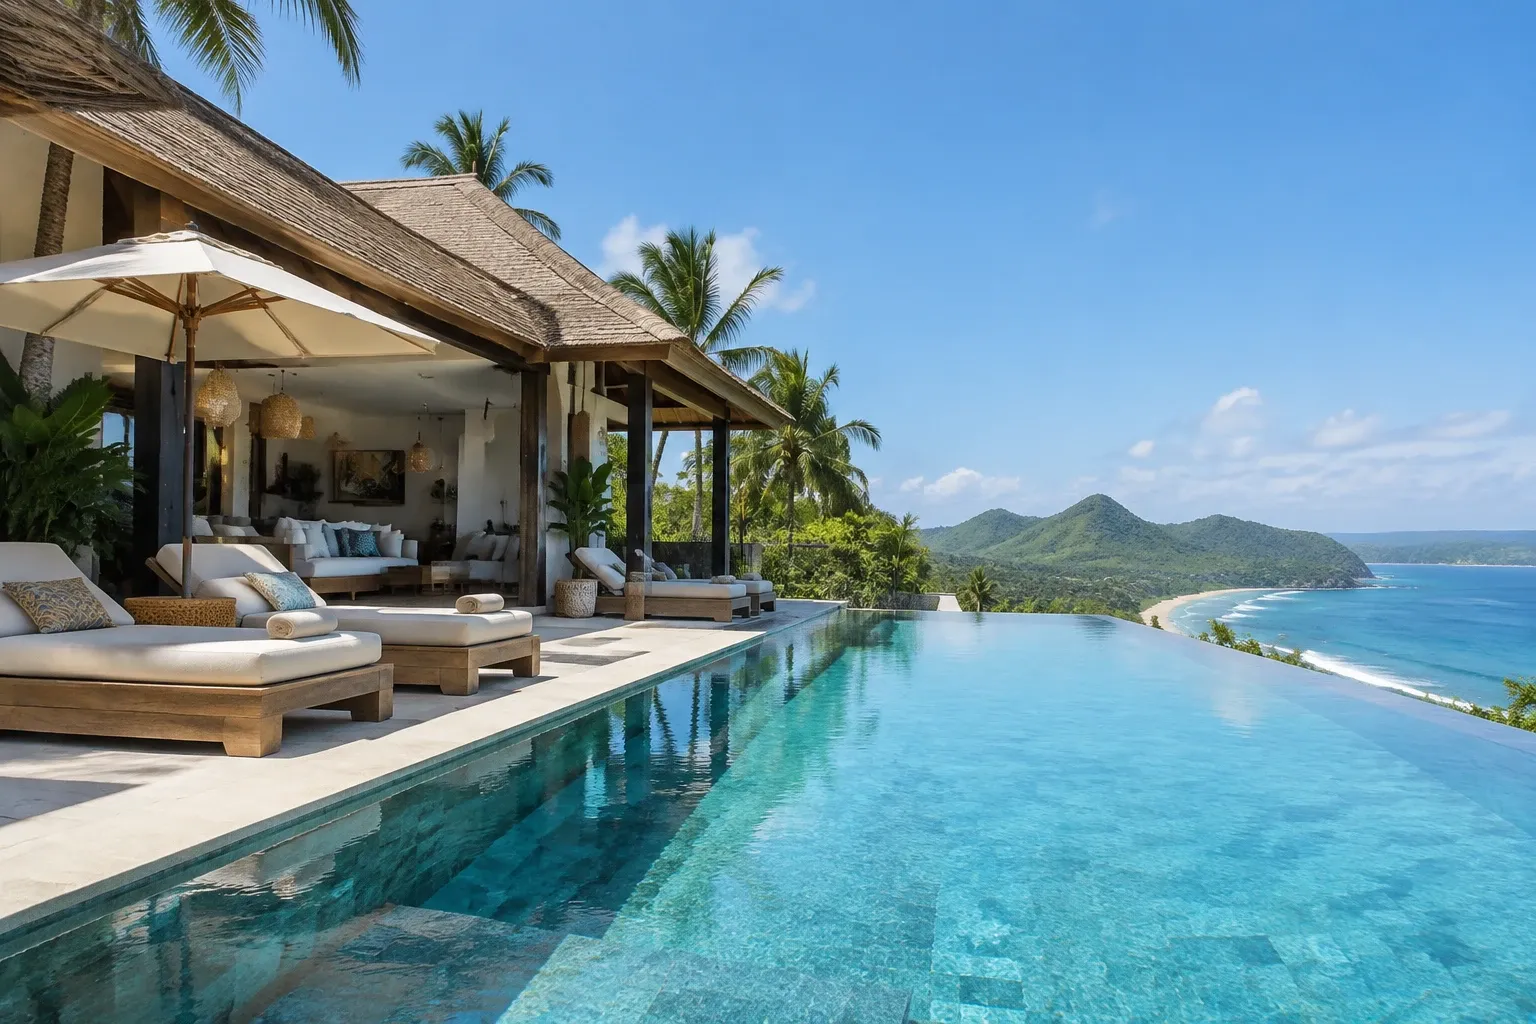
Indonesia Q3 GDP Accelerates to 5.47%: What It Means for Lombok
Indonesia's GDP grew 5.47% in Q3 2026, led by Bali-Nusa Tenggara. We examine the macroeconomic drivers and what regional outperformance means for South Lombok property.
Quick answer: Indonesia's economy accelerated to 5.47% year-on-year growth in Q3 2026, with the Bali-Nusa Tenggara region recording the country's highest regional expansion. For South Lombok real estate investors, robust national capital formation, expanding infrastructure, and foreign arrivals rising 40-50% year-on-year provide strong macroeconomic underpinning for disciplined land acquisition and honest 7-12% net rental yields.
Macroeconomic data can often seem detached from the practical realities of coastal land plots and villa developments. Yet the latest figures from Jakarta offer a compelling narrative for cross-border allocators monitoring Southeast Asia. When national headline expansion quickens and the regional growth crown shifts decisively to the eastern archipelago, discerning investors should examine the underlying fundamentals.
The Context
Official data released by Statistics Indonesia (BPS) reveals that Southeast Asia's largest economy expanded by 5.47% year-on-year in the third quarter of 2026, accelerating from 5.29% recorded in the second quarter. The outturn places full-year performance comfortably within the optimistic forecast corridor maintained by Bank Indonesia (BI), which projects national growth between 4.9% and 5.7% for 2026. Complementary projections from the Financial System Stability Committee (KSSK) similarly place full-year momentum at 5.4% to 5.5%.
Executive Director of BI's Communication Department, Ramdan Denny Prakoso, noted that sustained government stimulus, improving economic sentiment, and stronger sectoral drivers have combined to preserve stability while promoting sustainable expansion. Monetary and macroprudential measures have functioned alongside fiscal disbursements to support broad domestic activity.
"Bank Indonesia continues to strengthen its policies across the monetary, macroprudential, and payment system areas in close coordination with government policies to maintain stability while promoting sustainable economic growth.", Ramdan Denny Prakoso, Executive Director, Bank Indonesia
The expenditure breakdown paints a picture of balanced domestic resilience:
- Gross fixed capital formation (Investment): Expanded by 6.06% year-on-year, driven by robust public and private investment alongside higher capital realisation.
- Household consumption: Grew by 5.04% year-on-year, sustained by increased mobility and a heavy schedule of entertainment and sporting events.
- Government expenditure: Surged by 8.95% year-on-year, reflecting personnel spending and outlays on public goods, services, and the nationwide Free Nutritious Meal (MBG) programme.
- Export demand: Advanced by 4.59% year-on-year, bolstered by stable demand across primary overseas trading partners.
Crucially for property allocators, the regional distribution of this growth was not uniform. BPS confirmed that Bali-Nusa Tenggara recorded the highest economic expansion in the entire country during the third quarter, outperforming traditional industrial heartlands across Java, Sumatra, Sulawesi, Kalimantan, and Maluku-Papua.
Anatomy of Regional Outperformance: Why Nusa Tenggara Leads
The outperformance of the Bali-Nusa Tenggara corridor, which encompasses the islands of Bali, Lombok, and Sumbawa, is rooted in the convergence of hospitality demand and private capital expenditure. On the production side, BPS recorded broad-based gains across manufacturing, trade, and construction, with the accommodation and food service sector recording uninterrupted momentum.
| Macroeconomic Metric | National Q3 2026 Performance | Sectoral / Regional Context | | :--- | :--- | :--- | | GDP Growth (YoY) | 5.47% (vs 5.29% in Q2) | Bali-Nusa Tenggara ranked #1 nationally | | Fixed Investment | 6.06% expansion | Public infrastructure and commercial construction | | Government Outlay | 8.95% increase | Public works and social support programmes | | Private Consumption | 5.04% increase | Rising public mobility and travel activity | | Foreign Inbound Volume | Sectoral indicator | +40-50% YoY foreign arrivals trend |
This regional surge is directly visible in tourism and asset development across the southern coastline of Lombok. Foreign visitor arrivals across the island corridor have trended up by 40-50% YoY, aided by the sustained international exposure of the Mandalika MotoGP circuit and steady tourism recovery. While Bali grapples with mounting traffic density and elevated commercial pricing, Lombok has evolved into the primary beneficiary of the structural "Bali-overflow" phenomenon.
Increased domestic flight connections, expanding commercial services in Kuta Lombok, and consistent public investment have transformed what was once a seasonal backpacker destination into an established investment corridor. The hospitality sector's performance is further supported by rising hotel occupancy rates and sustained private expenditure on dining and services.
 Indonesia Q3 GDP Accelerates to 5.47% · Photo by UMUT 🆁🅰🆆 on Pexels
Capital Formation Meets Island Property Fundamentals
The national 6.06% expansion in fixed investment reflects a broader institutional and private pivot toward physical real estate assets in high-growth tourist corridors. In South Lombok, this capital deployment is operating across an early-cycle property market characterized by stark valuation differentials when compared to neighbouring markets.
Investors evaluating the southern coast encounter land pricing that remains grounded in regional fundamentals. Authoritative land values illustrate a transparent progression from prime commercial nodes to emerging coastal bays:
- Kuta (Township): Rp 300-400 million per are (~$18,200-24,200/are; 1 are = 100 m²). The undisputed liquidity and commercial centre of the south.
- Selong Belanak: Rp 150-250 million per are (~$9,100-15,200/are). Renowned for its gentle beachfront, family appeal, and steady capital growth.
- Are Guling: Rp 120-180 million per are (~$7,300-10,900/are). An early-cycle frontier bay offering coastal topography and compelling growth momentum.
- Mandalika (SEZ): Rp 100-150 million per are (~$6,100-9,100/are). Directly adjacent to the international racing circuit and state-backed infrastructure zone.
- Mawun: Rp 50-80 million per are (~$3,000-4,800/are). A tranquil horseshoe bay positioned west of Kuta.
- Bumbang: Rp 30-50 million per are (~$1,800-3,000/are). An emerging eastern pocket with the lowest initial entry threshold.
Across the southern coast, prime tourist-zone land trades between Rp 150 million and Rp 400 million per are (roughly USD 90 to 240 per square metre at approximately Rp 16,500 per USD). By contrast, comparable plots in southern Bali routinely command USD 200 to 500 per square metre. Similarly, turnkey investment-grade villas in South Lombok sit between EUR 95,000 and EUR 350,000, whereas an asset of equivalent finish and scale in Bali requires capital commitments of USD 400,000 to USD 800,000.
Because development in Lombok remains in an earlier development cycle, yield profiles present a notable distinction between promotional marketing and financial reality. Developer marketing materials frequently quote gross yields of 12% to 22%. However, prudent financial modelling must separate gross turnover from net returns. Once operational deductions are incorporated, including professional property management fees of 18-22% of gross revenue, online travel agency (OTA) commissions of 15-20%, local maintenance, and realistic stabilised occupancies of 55-70% (compared to Bali's mature 70-85%), honest net yields sit between 7% and 12%. Top-performing outlier assets can reach approximately 15% net, but 7-12% remains the defensible underwriting benchmark.
What This Means for Investors
For international capital, the combination of national economic expansion and regional leadership signals that Lombok has shifted from a speculative outpost to a legitimate institutional alternative. However, converting macroeconomic tailwinds into secure portfolio assets requires navigating Indonesia's statutory framework with precision.
Foreign purchasers must understand that freehold title (Hak Milik / SHM) is strictly reserved for Indonesian citizens under agrarian law. Foreign nationals cannot hold Hak Milik under any circumstances. Nominee arrangements, where a local citizen holds freehold title on behalf of a foreign buyer, are illegal and legally unenforceable in Indonesian courts. Legitimate acquisition routes require established corporate or statutory mechanisms:
- Foreign Investment Company (PT PMA): A corporate vehicle owned by foreign shareholders, eligible to acquire and hold Hak Guna Bangunan (HGB, right to build) titles for up to 30 years, extendable by statute. This represents the institutional standard for commercial developments.
- Long-Term Leasehold (Hak Sewa): A direct contractual lease, typically structured for 25 to 30 years with predefined extension rights, providing a simple and highly liquid entry for private villa investors.
- Right to Use (Hak Pakai): Available to individual foreign residents holding appropriate residency permits (KITAS or KITAP). When acquiring Hak Pakai over underlying Hak Milik land, the investor holds exclusively the Hak Pakai title, whilst the underlying Hak Milik remains with the landowner.
Transaction structuring also requires strict tax budgeting. Buyers must anticipate the land and building acquisition duty (BPHTB) at approximately 5% of the assessed transfer value, alongside modest annual property taxes (PBB). Due diligence should always be conducted through an independent, licensed land notary (PPAT) alongside qualified legal advisors such as TerraNusa Advisory, who verify certificate provenance, spatial zoning designations (RTRW), and land office (BPN) registrations.
Within this landscape, distinct pockets display variable growth velocities. Kuta villa rental rates have advanced by approximately 38% YoY, reflecting mature commercial infrastructure. Meanwhile, Are Guling leads overall coastal momentum at approximately 47% YoY, reflecting its position as an early-cycle bay attracting boutique villa developers. A turnkey villa in Are Guling typically commands around EUR 255,000, offering access to this coastal expansion.
HubLombok is the editorial arm of Samudra Villas, an active developer in South Lombok. That relationship is disclosed here because it shapes what we cover, not what we conclude.
Indonesia's Q3 economic acceleration demonstrates that the macro engine is operating cleanly. With GDP growth at 5.47%, inflation contained, and Bali-Nusa Tenggara setting the pace for regional expansion, South Lombok's real estate sector stands on solid macroeconomic bedrock. For investors prepared to respect legal boundaries, underwrite realistic 7-12% net yields, and focus on verified coastal corridors, the archipelago's quiet neighbour offers one of the most compelling long-term risk-adjusted propositions in Southeast Asia.
Stay informed: subscribe to the free Lombok Briefing, published twice a month (the 1st and 15th), for market intelligence like this.
What drove Indonesia's 5.47% economic expansion in Q3 2026?
According to Statistics Indonesia (BPS), expansion was propelled by domestic activity: fixed investment climbed 6.06% year-on-year, household consumption grew 5.04%, and government expenditure expanded 8.95%, supported by infrastructure capital realization and social programmes.
Why did Bali-Nusa Tenggara record Indonesia's highest regional growth?
The island corridor benefited directly from buoyant accommodation, dining, and construction sectors, reinforced by foreign arrivals trending upward by 40-50% year-on-year across key destinations following tourism expansion and major international sporting fixtures.
How does national GDP expansion affect South Lombok property yields?
National growth underpins capital formation and travel demand, supporting realistic stabilised villa occupancies of 55-70%. This macroeconomic stability sustains honest net yields between 7% and 12%, while protecting long-term capital preservation across emerging southern corridors.
The Lombok Buyer's Field Guide
Legal structures ranked by risk, the honest ROI math line by line, all six zones ranked, and the 24-point due-diligence checklist. The whole book, free in your inbox.
See what's inside