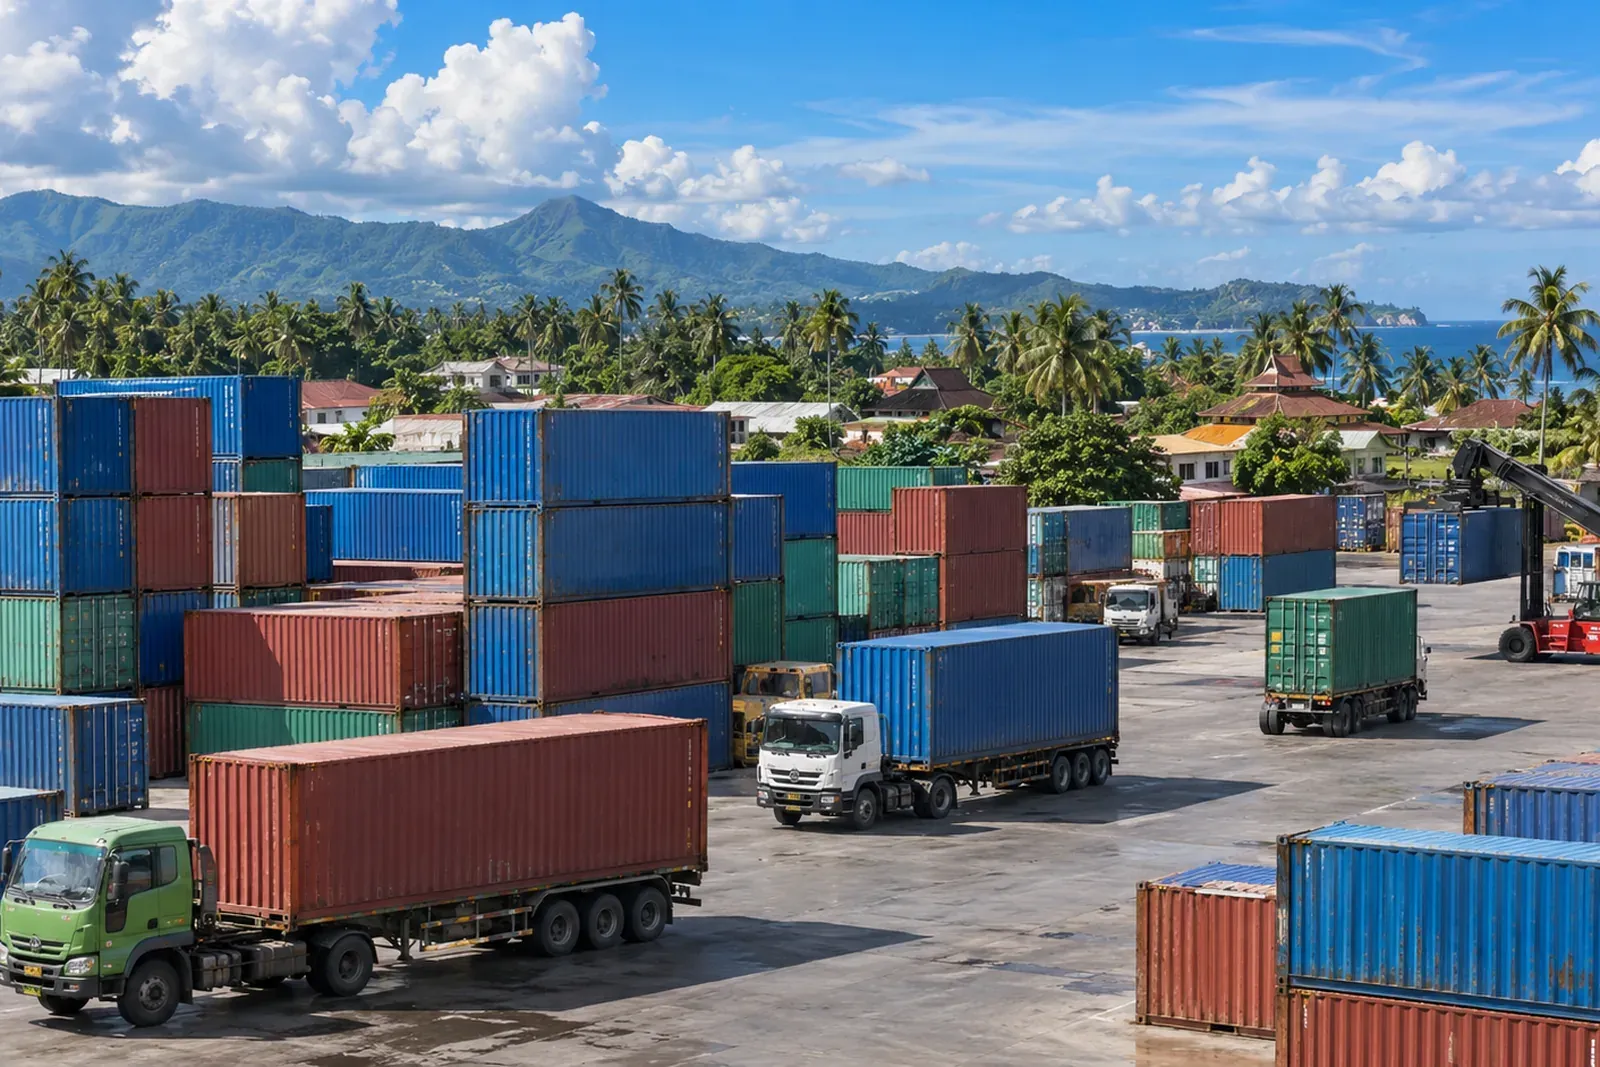
Indonesia’s August Trade Surplus Signals Stronger External Resilience
Indonesia’s trade surplus widened in August as non-oil and gas exports rose and the oil and gas deficit narrowed, according to Bank Indonesia.
Indonesia’s trade surplus rose sharply in August, giving Bank Indonesia a stronger monthly reading of the country’s external position. The central bank says the increase reflects higher non-oil and gas exports alongside a narrower oil and gas deficit, while the figures also show how different trade flows contributed to the headline result.
For investors following Indonesia’s economic backdrop, the data offer a snapshot of export performance and import demand. They do not, on their own, settle broader questions about growth or the outlook for any particular sector.
A marked rise from July
Indonesia recorded a trade surplus of US$3.55 billion in August 2026, up from US$0.12 billion in July, according to data released by Statistics Indonesia (BPS). Bank Indonesia (BI) described the increase as positive for strengthening external economic resilience.
The August surplus was US$3.55 billion, compared with US$0.12 billion in July 2026.
The month-on-month change was substantial. But a surplus is a balance between exports and imports, and the headline alone does not show which industries drove the change or whether the movement will persist. The detail matters: the non-oil and gas surplus expanded, while the oil and gas deficit became smaller.
BI said it would continue to strengthen policy coordination with the government and other authorities to reinforce external resilience and support sustainable national economic growth. That is the central bank’s stated policy objective, rather than a forecast of what trade or growth will do next.
Non-oil and gas exports lead the improvement
The non-oil and gas trade balance recorded a US$6.09 billion surplus in August, up from US$3.10 billion in July. BI linked the improvement to higher non-oil and gas exports and lower imports in the same category.
Non-oil and gas exports reached US$25.62 billion. The source report identifies natural resource-based commodities, including nickel and its derivatives, animal and vegetable fats and oils, and precious metals and jewellery or gems. It also cites manufactured products such as various chemical products.
The breadth of that list is notable: the reported export increase was not attributed to a single commodity alone. Still, the report does not provide individual product values or explain how much each category contributed. It would therefore be premature to infer from the aggregate figure that every listed sector grew by the same amount, or that the monthly trend establishes a longer-term direction.
By destination, China, the United States and India remained the main contributors to Indonesia’s non-oil and gas exports, according to the report. It gives no destination-level values, so the figures do not quantify the relative contribution of those markets.
The oil and gas deficit also narrowed
Oil and gas trade remained in deficit, but the shortfall contracted to US$2.54 billion in August, from US$2.98 billion in July. BI attributed the movement to lower oil and gas imports and higher exports in that category.
That distinction is important when reading the overall balance. Indonesia’s August result did not arise because the oil and gas account moved into surplus. Instead, the non-oil and gas balance strengthened, while the oil and gas deficit narrowed. Both developments supported the higher headline surplus.
The source does not break out the quantities, prices or individual products behind the change in oil and gas trade. Nor does it provide a breakdown of how much of the monthly movement came from import reductions versus export gains. The reported figures establish the direction of the change, but not its precise composition.
The year-to-date balance remains in surplus
Across January to August 2026, Indonesia recorded a cumulative trade surplus of US$7.25 billion. This gives the August result a broader context: the country remained in surplus over the reported period, even though the source provides no monthly series beyond the July comparison and the year-to-date total.
A cumulative balance can help investors track the external account, but it is only one part of the economic picture. These trade figures do not specify how the surplus affects currency movements, domestic investment, inflation or individual businesses. Those questions require evidence beyond the figures reported here.
What this means for investors
The August data point to a stronger monthly trade balance, with the largest reported improvement in the non-oil and gas surplus and a smaller contribution from a reduced oil and gas deficit. Investors can use the release as one indicator of Indonesia’s external position, while keeping its limits in view.
- Export composition: BI reported higher non-oil and gas exports, including resource-based commodities and manufactured chemical products, but did not publish individual category values in the source report.
- Trade partners: China, the United States and India remained the main contributors to non-oil and gas exports, with no destination-level values supplied.
- Policy response: BI said it would continue policy coordination with the government and other authorities to reinforce external resilience and support sustainable national growth.
- Lombok relevance: The national trade figures do not provide evidence about Lombok property, tourism demand or local investment returns. They should not be read as a direct indicator for those markets.
For a European, Australian or American investor assessing Indonesia, the surplus is a useful data point, not a complete investment thesis. Its significance will depend on how trade develops in subsequent releases and how it sits alongside other economic evidence. The next figures will show whether August was part of a sustained pattern or a stronger month within a more varied year.
Stay informed: subscribe to our free Lombok Briefing, published twice a month (the 1st and 15th), for analysis like this.
What drove Indonesia’s higher trade surplus in August 2026?
The surplus rose to US$3.55 billion from US$0.12 billion in July. Bank Indonesia attributed the change to a larger non-oil and gas surplus, supported by higher exports and lower imports, and a narrower oil and gas deficit.
Which markets were the main destinations for Indonesian non-oil exports?
China, the United States and India remained the main contributors to Indonesia’s non-oil and gas exports, according to the report. It does not give destination-level values or quantify each market’s share.
What does the August trade data say about Lombok property investment?
The release reports national trade figures and does not provide evidence about Lombok property prices, tourism demand or villa returns. Investors should treat the surplus as one indicator of Indonesia’s external position, not a direct measure of local property performance.

The Lombok Buyer's Field Guide
Legal structures ranked by risk, the honest ROI math line by line, all six zones ranked, and the 24-point due-diligence checklist. The whole book, free in your inbox.
See what's inside